GrandStay Hospitality — Operations Intelligence (Power BI case study)
A portfolio case study that builds a measurable time, scale and cost baseline for 120,000 guest-support tickets at a fictional global hotel group, before any decision to buy an automated “travel concierge”. Built in Excel, Power Query, PivotTables and Power BI.
TypePortfolio case study (not a client engagement)
ToolsExcel · Power Query · PivotTables · Power BI · PowerPoint
Grain1 row per ticket (120,000) + 12 monthly cost rows
PeriodTickets 9 Jul–7 Oct 2025; costs Nov 2024–Oct 2025
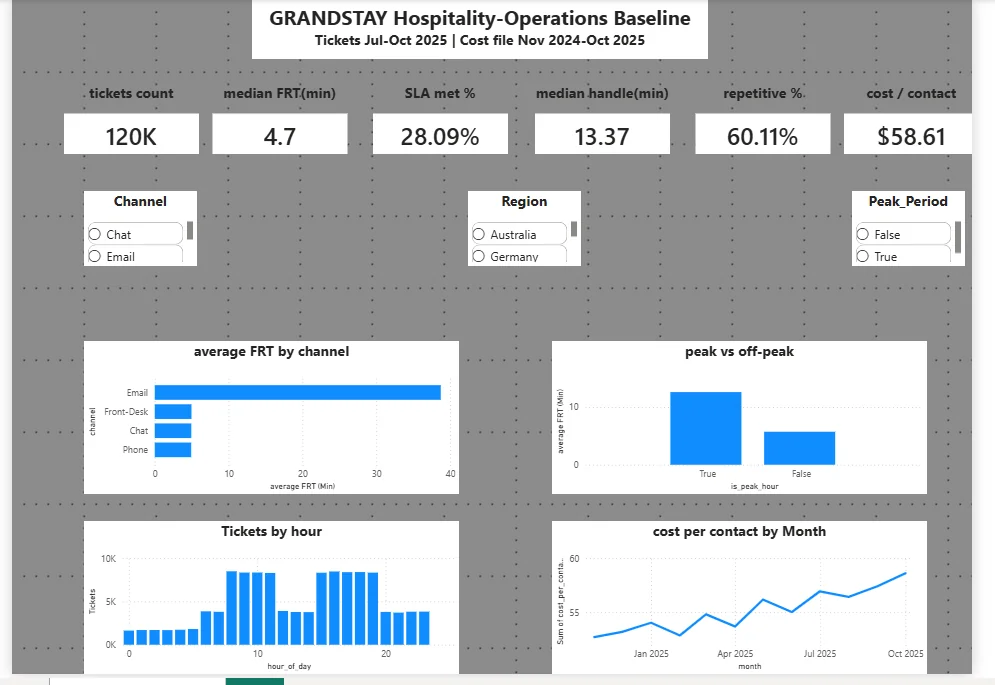
Executive page of the Power BI dashboard (screenshot from the repository).
Problem
Guest support was under pressure: slow first response, missed SLAs, repetitive guest questions, rising cost per contact, falling utilisation and rising overtime. Leadership was considering an Intelligent Travel Concierge. This project measured the baseline first, so that any automation decision could be judged against facts rather than a vendor pitch.
Data and method
Source tables and grain
Source
Grain
Rows
Agent performance logs
1 ticket
120,000
Cost efficiency metrics
1 month
12
Knowledge / escalation sample
1 ticket
5,000
Inquiry volume patterns
hour × region × channel
43,125
Power Query metrics FRT, HANDLE_TIME_MIN and SLA_STATUS, using each ticket’s own sla_target_min (Phone 1.5, Chat 2, Front-Desk 5, Email 30 minutes).
Ticket and cost tables were deliberately not joined, because they sit at different grains (ticket vs month).
Median first response time is reported instead of the mean: the mean (10.0 min) is pulled up by Email (about 39 min), while live channels sit near 5 minutes.
Results
Executive KPIs
KPI
Result
Tickets
120,000
Median first response time
4.7 min
SLA met
28.09%
Median handle time
13.37 min
Repetitive tickets
60.11%
Cost per contact (Oct 2025)
$58.61
SLA and first response by channel (minutes)
Channel
SLA met
Off-peak FRT
Peak FRT
Phone
15.28%
2.80
6.20
Chat
23.00%
2.78
6.22
Email
47.68%
21.91
48.90
Front-Desk
60.77%
2.79
6.24
Cost and workforce, Nov 2024 vs Oct 2025
Measure
First
Last
Inquiries
11,649
16,219 (+39%)
Cost per contact
$52.71
$58.61
Utilisation
86.0%
72.8%
Overtime hours
1,196
1,824
Findings
Time. 72% of tickets missed SLA. Phone and Chat fail because their targets are 1.5–2 minutes, not because they are slower than Email.
Scale. 60% of tickets are flagged repetitive and take 10.8 minutes of handle time, versus 29.1 for other work.
Cost. Volume rose 39% while cost per contact rose and utilisation fell.
Automation. “Minutes saved” in the knowledge sample is largest on Legal, Billing, Emergency, Complaint and Contract tickets only because those tickets are already long, so it should not be used to rank automation candidates.
Recommendations
Staff and route Chat and Phone in peak hours before buying a new tool; keep Email on its 30-minute target.
Pilot a concierge on repetitive FAQ categories on Chat, with a human handoff for non-standard requests.
Do not automate Legal, Emergency, Complaint, Contract or Billing first.
Review roster against peak demand rather than hiring 1:1 with monthly ticket growth.
Report median FRT and FRT by channel instead of a single 10-minute company average.
What this project demonstrates
Power Query modelling: ticket-level metrics (FRT, HANDLE_TIME_MIN, SLA_STATUS) built against each ticket’s own SLA target.
Grain discipline: ticket and monthly cost tables kept separate rather than joined at mismatched grains.
Power BI reporting: a three-page dashboard (executive, time and demand, cost and workforce).
Decision support: recommendations tied to the evidence, with an explicit warning against ranking automation by a misleading field.
Limits
No CSAT conclusion is drawn. The knowledge file is a sample. Cost cannot be sliced by channel. No bot was implemented, and no hours-saved or money-saved outcome exists in this dataset. The .pbix file and the 50 MB Excel workbook are intentionally kept off GitHub.
Written by Emmanuel Abolade, Data Analyst, Business Intelligence Developer and Full-Stack Software Developer based in Hull, UK. Every figure on this page comes from the linked public repository or live demo.