Definitions
- Denominator: orders with
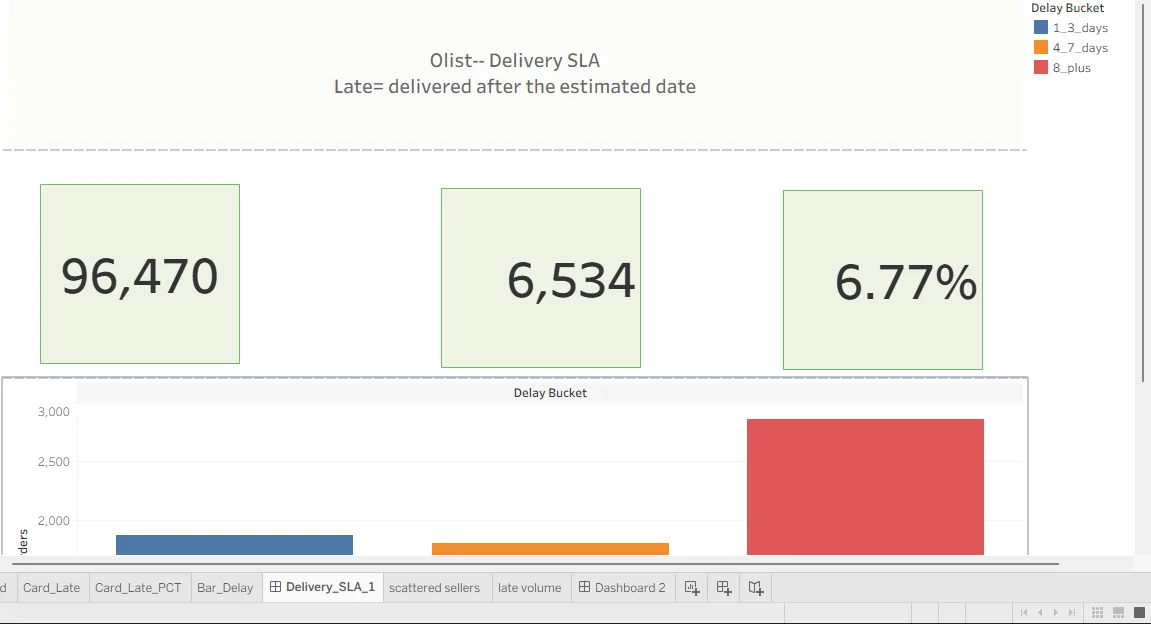
order_status = 'delivered'that have both a delivered date and an estimated date (96,470). - Late: delivered on a calendar day after the estimated day. Same-day delivery counts as on time.
The core rule in T-SQL compares dates, not timestamps:
case when cast(order_delivered_customer_date as date)
        > cast(order_estimated_delivery_date as date)
     then 1 else 0 end as is_late
Results
| KPI | Value |
|---|---|
| Delivered orders with dates | 96,470 |
| Late orders | 6,534 (6.77%) |
| 8+ days late | 2,862 (44% of late orders) |
| High-rate sellers (20+ orders, late rate ≥ 20%) | 23 sellers, 3.8% of late lines |
| Top 15 sellers by late lines | 1,517 lines (~21% of late lines) |
| Average review, on-time vs late | 4.29 vs 2.27 |
Recommendations
- Coach the top 15 sellers by late volume, not the 23 sellers with the highest late rate, because volume is where most late lines sit.
- Treat 8+ day delays separately from 1–3 day slips.
- Do not penalise sellers with fewer than 20 orders.
What this project demonstrates
- SQL Server / T-SQL: explicit denominator and lateness rules, date-level comparison, seller aggregation.
- Cross-validation: the same KPI reproduced in Python (96,470 / 6,534 / 0.0677).
- Tableau: delivery SLA and seller views.
- Prioritisation: sizing sellers by late volume rather than late rate, so effort goes where most late orders are.
Limits
Lateness is an order-level fact copied onto every item line. Reviews are not one per order. The dataset contains no cost or CSAT money impact, so none is claimed.
Written by Emmanuel Abolade, Data Analyst, Business Intelligence Developer and Full-Stack Software Developer based in Hull, UK. Every figure on this page comes from the linked public repository or live demo.