Problem
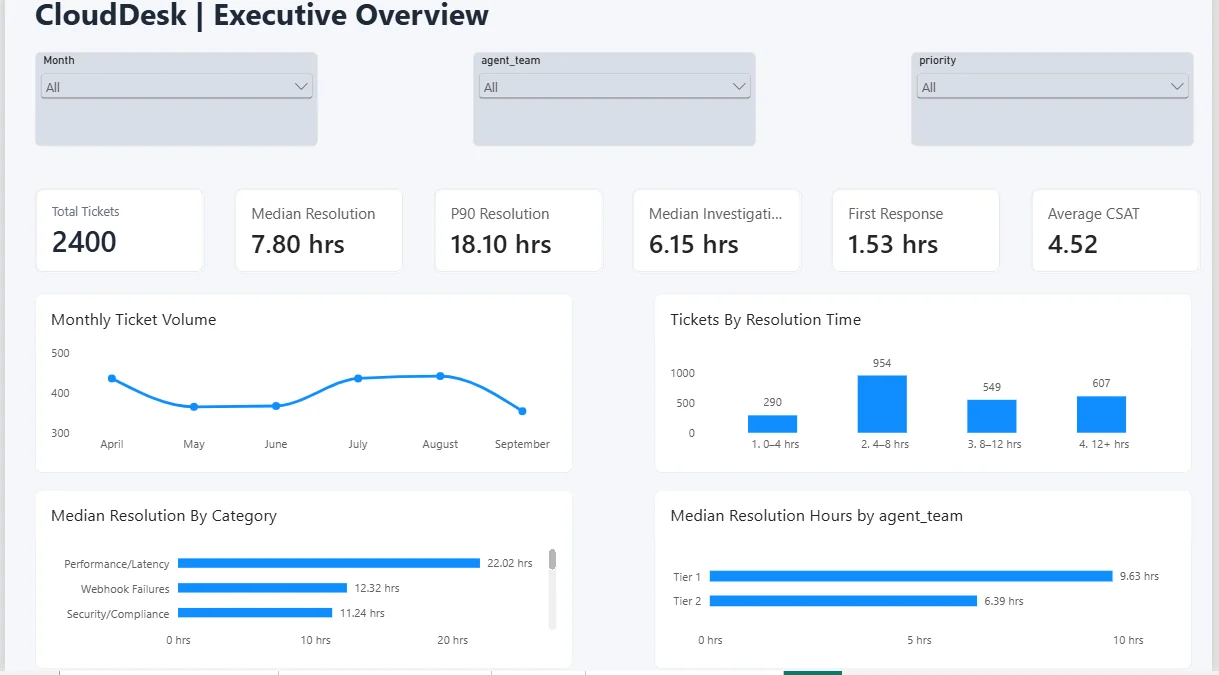
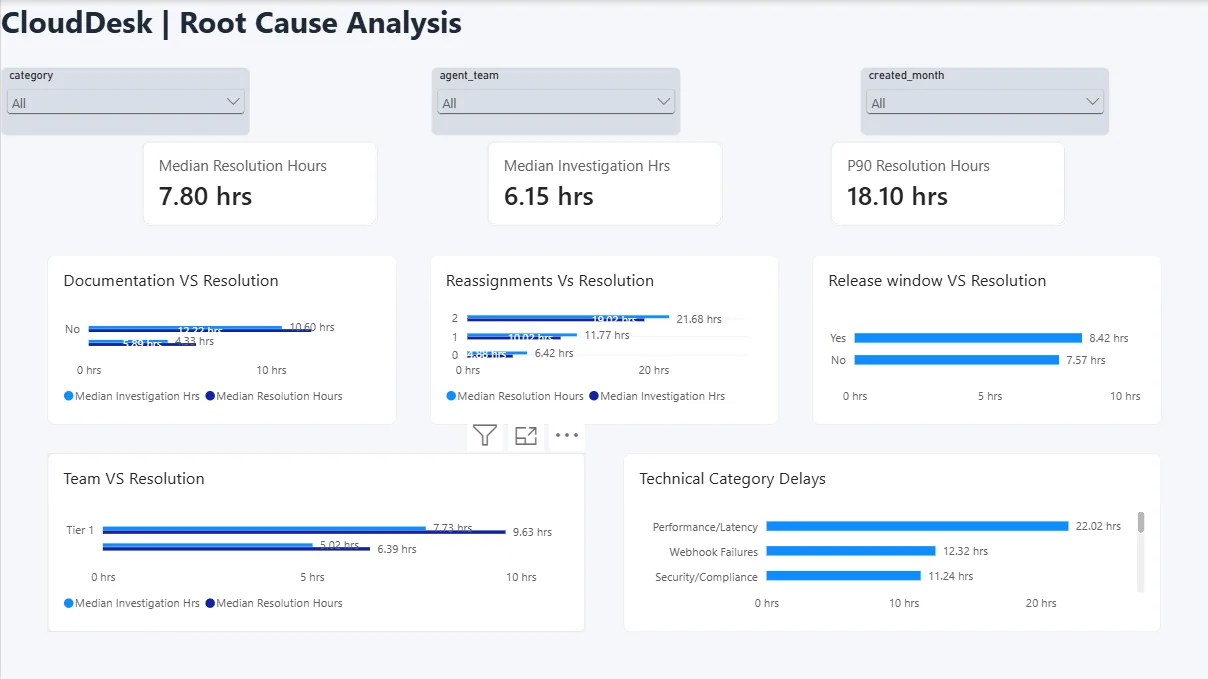
Support tickets were taking several hours or longer to resolve. Leadership’s working hypothesis was that documentation gaps were the main bottleneck. The project tested that hypothesis against alternatives: reassignment, team, ticket category, channel, priority, customer segment, FAQ status and release windows.
Data and method
- Resolution broken into stages: creation, first response, investigation and resolution.
- Profiling, cleaning and transformation in Jupyter notebooks (
01_data_ingestion,02_data_cleaning,3_business_impact), producing an analytical dataset and a dashboard dataset. - Because resolution time is right-skewed, a robust log-transformed regression was used; Variance Inflation Factor checks found no serious multicollinearity. An interaction model added little, so the simpler model was kept.
Results
| Measure | Value |
|---|---|
| Median resolution | 7.80 hours |
| Mean resolution | 9.74 hours |
| P90 resolution | 18.10 hours |
| Median first response | 1.53 hours |
| Median investigation | 6.15 hours |
| Average CSAT | 4.52 |
| Renewal rate | 97.38% |
| Factor | Comparison |
|---|---|
| Documentation available | 5.89 with documentation vs 12.22 without |
| Reassignments | 6.42 (0) · 11.77 (1) · 21.68 (2) |
| Team | Tier 1: 9.63 (1,176 tickets, 3 agents) vs Tier 2: 6.39 (1,224 tickets, 11 agents) |
| Category | Performance/Latency 22.02 · Webhook Failures 12.32 · Security/Compliance 11.24 (overall 7.80) |
Customer impact
Resolution time is negatively associated with CSAT (Pearson −0.419, Spearman −0.328, p < 0.001). Average CSAT falls from 4.73 in the fastest quarter of tickets to 4.20 in the slowest. Tickets linked to non-renewal had a median resolution of 27.55 hours versus 7.70 for renewed, but there are only 63 such tickets, so this is reported as an association, not a cause.
Recommendations
The findings were turned into an eight-item operational backlog with success metrics, covering a documentation audit and improvements, reassignment and routing, ownership and escalation rules, a team workload review, diagnostic workflows for Performance/Latency and Webhook Failures, and an investigation-time KPI.
Limits
- All results are statistical associations, not causal estimates.
- Channel, priority, segment, FAQ status and release-window status showed limited independent explanatory value in the multivariate model.
- Renewal effects rest on 63 non-renewal tickets and should be retested at customer level.
What this project demonstrates
- Python analytics: a reproducible notebook workflow from ingestion to business impact.
- Statistics: robust regression on a skewed outcome, multicollinearity checks and correlation testing, with careful causal language.
- Power BI: a four-page management dashboard built on the processed Python output.
- Operational recommendations: findings converted into a prioritised backlog with measurable success metrics.
Written by Emmanuel Abolade, Data Analyst, Business Intelligence Developer and Full-Stack Software Developer based in Hull, UK. Every figure on this page comes from the linked public repository or live demo.