Problem
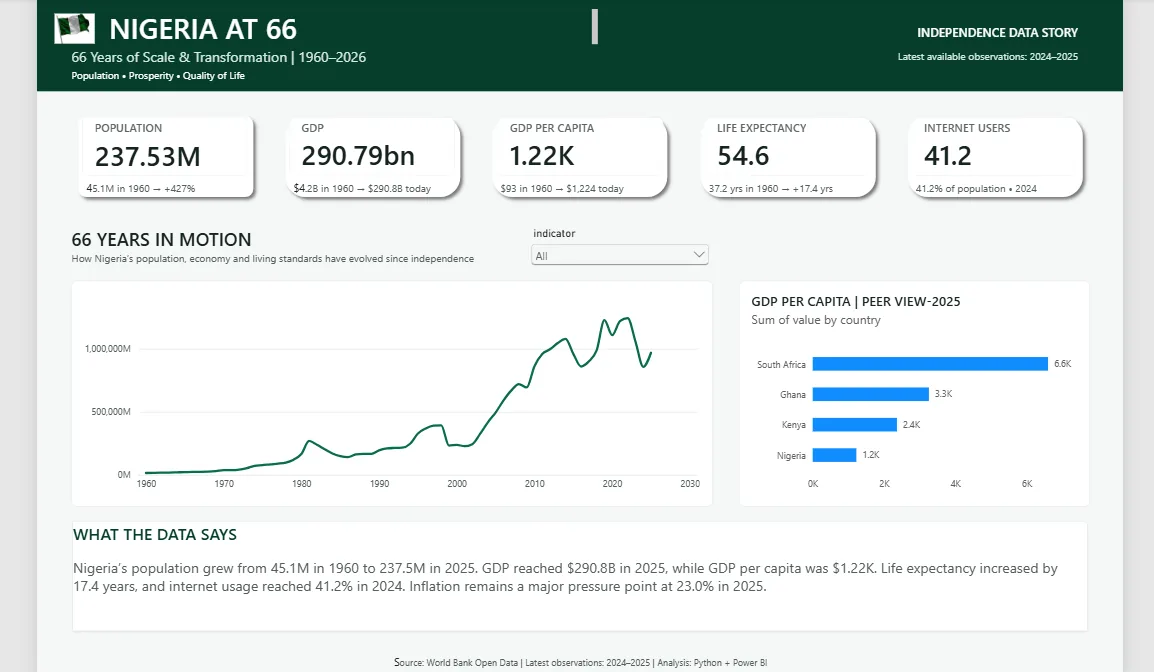
Headline figures about a country’s growth are easy to quote and easy to misread. The question here was how Nigeria has changed since 1960 across population, the economy and quality of life, and whether economic scale has translated into better outcomes per person, presented so a non-technical reader can follow it in one page.
Solution and architecture
World Bank API (v2, JSON)
      ↓  src/fetch_world_bank.py  (requests, retries with back-off)
Raw CSV  data/raw/world_bank_indicators.csv
      ↓  pandas validation and reshaping (Jupyter)
Power BI-ready CSV  data/processed/nigeria_at_66_powerbi.csv
      ↓
Power BI single-page report  dashboard/naija_powerbi.pbix
The extractor requests each indicator per country for 1960–2026, retries failed calls up to three times with increasing waits, and writes tidy rows of country, year, indicator and value. The processed file adds a Nigeria flag and a decade field for the report.
Technologies
Python (requests, pandas), Jupyter for exploration, Power BI for modelling, KPI cards, an indicator slicer and a peer benchmark, and Git for version control.
Results
| Indicator | Earliest | Latest |
|---|---|---|
| Population | 45.1M (1960) | 237.5M (2025) |
| GDP, current US$ | $4.2bn (1960) | $290.8bn (2025) |
| GDP per capita, current US$ | $93 (1960) | $1,224 (2025) |
| Life expectancy | 37.2 years (1960) | 54.6 years (2024) |
| Internet users | ≈0% (1990) | 41.2% (2024) |
| Inflation | 5.4% (1960) | 23.0% (2025) |
Population grew by roughly 427% and life expectancy rose by about 17.4 years. The GDP per capita comparison with Ghana, Kenya and South Africa shows why national economic scale and individual economic outcomes should not be treated as the same thing.
Limitations
- GDP figures are in current US dollars, so they are affected by inflation, exchange rates and data revisions; they are not measures of real growth on their own.
- The latest available year differs by indicator (mostly 2024–2025).
- Missing observations were kept as missing rather than imputed.
What this project demonstrates
- API integration: resilient extraction from a public REST API.
- Data preparation: validation and reshaping into a BI-friendly long format.
- Power BI storytelling: a single executive page with KPIs, trend, slicer and peer view.
- Analytical honesty: explicit caveats on nominal values and data coverage.
Written by Emmanuel Abolade, Data Analyst, Business Intelligence Developer and Full-Stack Software Developer based in Hull, UK. Every figure on this page comes from the linked public repository or live demo.